Digital Image Correlation (DIC)
Introduction:
Digital Image Correlation (DIC) is a proven, non-contact method for measuring deformation and strain in an object under test. The object may be as simple as a modest material sample or as large as an aircraft wing or as complex as a heart valve.
Whilst conventional strain gauge sensors require careful placement and are limited by size and the quantity that can be adhered to a surface in providing spatial resolution, Digital Image Correlation’s optical methods requires one or more hi-resolution camera, DIC software, and the object under test to be covered in a matte, high contrast, speckle pattern. We will look into closer detail at this speckle pattern later.
The key advantages of Digital Image Correlation include measurements of deformation and strain with a higher spatial resolution than can be achieved with an electro-mechanical strain gauge, and results free of any artefacts that adhesion of such strain gauges may cause. It also permits the measurement of deformation on objects that would be difficult or impossible to affix strain gauges.
Digital Image Correlation has three distinct stages; preparation, test, and analysis. In this article we focus on these stages in respect to TEMA Stereo DIC, however it is not a step-by-step instruction manual.
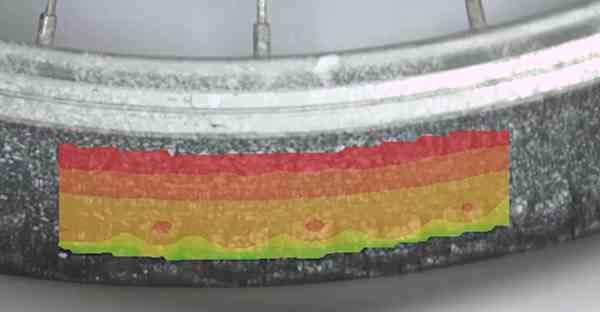
Fig. 1 - 2D DIC strain analysis of a bicycle tyre during compression cycle, courtesy Image Systems.

Definitions:
In engineering the following brief definitions generally apply.
Deformation refers to the change in size of shape of an object.
Displacement is the absolute change in position of a point. The SI base units are meters (m).
Strain (ε) describes the relative deformation in size of a material under stress. It is expressed as a ratio calculated by dividing the change in length by the original length.
| ε = | ΔL |
| L |
Stretching is represented by a positive strain, whilst a negative strain represents compression.
Stress (σ) is the force per unit area, applied to a surface, and usually expressed as pounds per square inch (psi), or pascals (Pa).
Preparation for DIC:
The Speckle Pattern
Unless there are sufficient natural features, a speckle pattern should be applied to the surface of the Area Of Interest (AOI) on the test object. When applying the speckle pattern, the following considerations should be observed.
-
The pattern should deform with the test object, i.e. it should adhere to the surface, and that surface should not be a rigid coating that fails to move with the body of the test object .
-
A matte and non-reflecting finish is preferable.
-
The pattern should be of high contrast. Typically black speckles on a white background or white speckles on a black background are used.
-
Aim for a ratio of 50% speckle and 50% space (i.e. 50% density).
-
Speckles should be random in position but uniform in size.
-
Speckles should cover between 3 x 3 and 7 x 7 pixels of the camera sensor. Note, lower resolution cameras will require either larger speckles or to be placed closer to the Area of Interest (field of view permitting).
Whilst it is common to apply the speckle pattern with paint, there are many alternatives including ink, dye, powder, marker pens, or on larger objects printed sheets adhered to the item’s surface. Whichever method is chosen, it should not fade or darken during the test procedure. The use of uniform LED lighting will avoid heatwaves.

Fig. 2 - 3D DIC on an enamel cup with a black speckle pattern on white background. Here the density ratio is below 50%, there are areas where more black dots will help provide better results.
The Camera(s)
For 2D Digital Image Correlation, one monochrome camera is required. For stereo Digital Image Correlation, two or more synchronised monochrome cameras are required. These camera(s) should be placed at a suitable distance to observe a field of view slightly larger than the area of interest.
When two cameras are used for stereo Digital Image Correlation, the intersection angle between the two cameras should be between 15 and 25 degrees, i.e. the distance between cameras should be a third the distance between the cameras and the test object. Below this angle it will be almost monocular stereo analysis. Above this, the perspective from each camera might have an impact on the stereo matching i.e. how the two cameras recognize automatically the same area to be analysed on the sample.
Mount the cameras to a rigid bar and to sturdy base and ensure they will not be affected by vibration or any other movement. Camera roll should be avoided, i.e. their horizontal axes should be parallel.
The DIC software may require you to enter both the focal length of the camera lens e.g. 25 mm, and the pixel size e.g. 3.45 µm. Have this information ready from the datasheets or use TEMA automated procedure and a calibration board to obtain the camera lens focal length.
When making a conventional data recording, for example power monitoring, one must consider using a sample rate sufficient to capture the fastest frequencies. Nyquist theorem specifies a sample rate twice that of the highest signal frequency. A similar practice applies to Digital Image Correlation. Here you can exchange the term sample rate for frame rate or frame frequency. A higher frame frequency will increase Temporal Resolution (TR), and make it easier for the software to track the deformation from frame to frame at the risk of introducing noise into the analysis when there is no movement.
Lighting
Digital Image Correlation will require the Area Of Interest to be well and evenly illuminated. Lighting must take into consideration the camera frame rate and thus permitted exposure time. Too much light and the AOI will be over exposed. Too little light and the AOI will be under exposed. Either way the speckle pattern will be undetectable.
The lights should also be placed to avoid hotspots, glare, and reflection. Image Systems’ DIC systems are supplied with lights. If additional lights are required, high performance LED lighting from our GS ViTec range is recommended https://photo-sonics.co.uk/products/led-lighting-for-high-speed-photography. Such lighting can be continuous or strobed in sync with the camera, and produces less heat than halogen lamps. Heat can be the enemy of a good DIC experiment. Not only can warming of the test object affect the material’s characteristics, but any heat waves generated can distort the images. A gentle airflow over the test object may be required to address this.
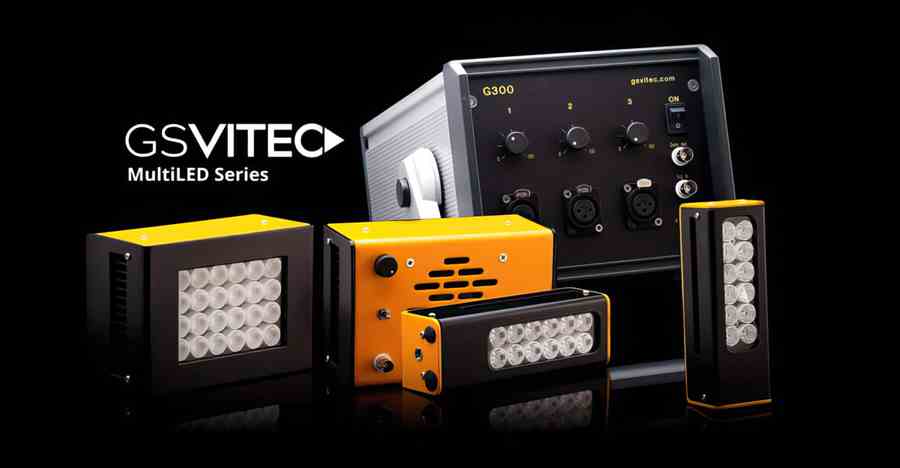
Fig. 3 – High performance LED lighting from GS ViTec.
The DIC Test (aka The DIC Experiment):
Check that the camera lens is clean of dirt, dust, fingerprints or any smearing. Focusing the camera on a white sheet of paper may help identify such foreign matter.
Once the test object and equipment have been positioned, ensure that the cameras and test object have the time required to warm up and temperatures are stable. Changes in camera position due to thermal expansion during a DIC test may be translated into movement of the test object. Lock the camera focus and any other manually adjustable components.
Now you are happy with the setup, capture a sample video to ensure good images. Then run the experiment and allow the DIC software to capture a series of images for the duration of the experiment.
Take a look for and mitigate the effects of people or things moving either in front of or behind the test object. Such movement may alter the lighting.
DIC Analysis:
With the experiment captured on video, we will need to perform a calibration, define the 3D coordinate system (if required), and match a sufficient number of position of the area of interest in camera view 1 with the same positions in camera view 2.
To do this we add six control points on the area of interest, ideally at the extremes, on the first frame of the captured video. This first frame is the reference image, and all subsequent frames will be compared to this. TEMA DIC allows some adjustment to aid selection of the control points and to define a search area in which the control point is expected to move during the test.
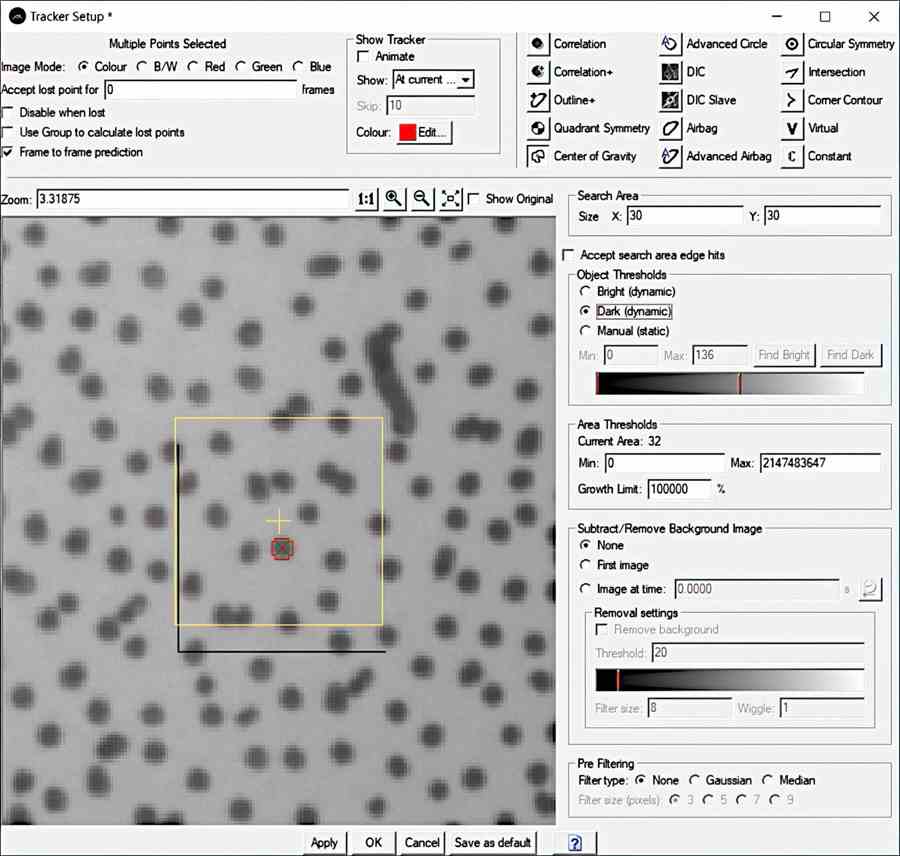
Fig. 4 – Screenshot from TEMA Stereo DIC Tracker Setup. Control Point selection and search area definition.
When all six control points are added in one camera view, we locate the matching control points in the second camera view. Magnified images can be overlaid to ensure that the control points in both views are a match.

Fig. 5 – Screenshot from TEMA Stereo DIC showing magnified view of control point.
With the points matched, calibration is a simple matter of entering in the measure distance between, for example the top left and top right control point. An imaginary line between these points can also be set as our y axis. As can an imaginary line between the top centre and bottom centre control points as the z axis.
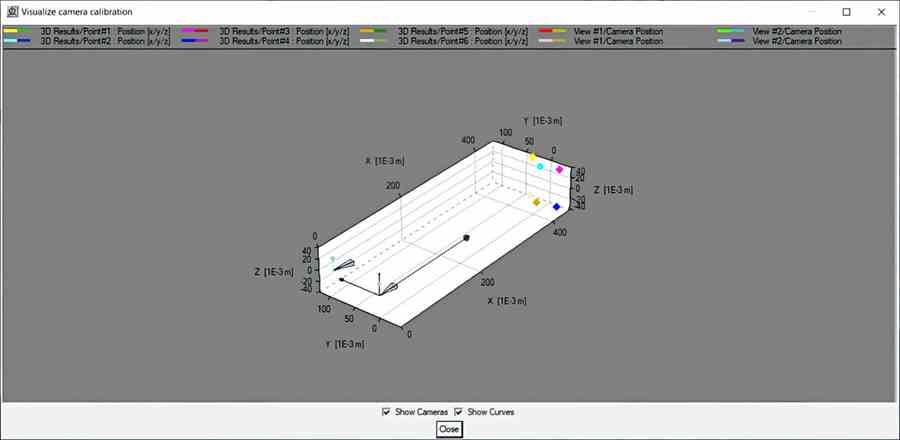
Fig. 6 – Screenshot from TEMA Stereo DIC showing visualization of camera calibration. The two cameras are represented by the blue and pink cones, whilst the control points on the mug are indicated by the coloured diamonds.
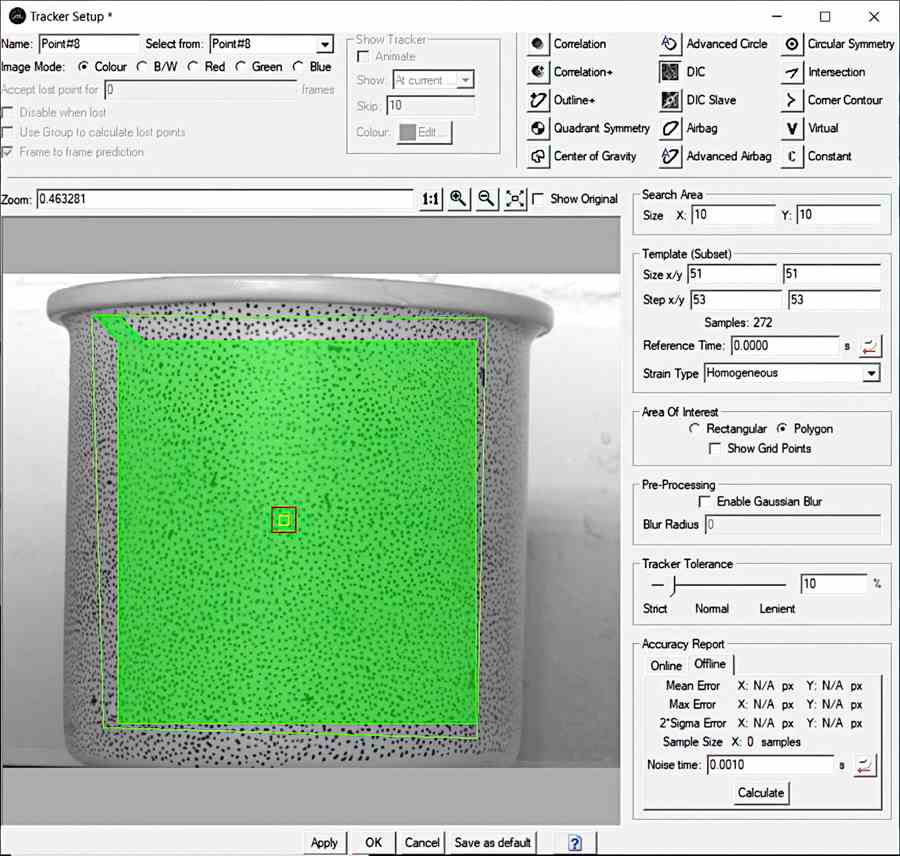
Fig. 7 – Screenshot from TEMA Stereo DIC showing the Area of Interest in green.
This done and verified, we can move on to defining the DIC area on camera view 1, typically equal to the Area of Interest and outlined by the six control points.
Two DIC concepts need to be explained; subset (aka Template), and Step Size. Both of these may need adjusting to achieve the most accurate results.
TEMA DIC divides the Area of Interest into smaller subsets upon which to calculate displacement. The DIC practitioner is given ability to define the size of the subset. In the screen shot above it is 51 pixels wide by 51 pixels high. The size should always be an odd number.
A subset should be large enough to include at least three speckles. A larger subset size increases the uniqueness of the subset and aids tracking, however this is at the cost of increased processing time and perhaps more importantly a depreciation in spatial resolution.
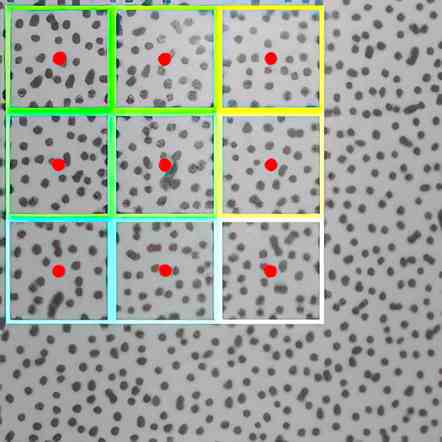
Fig. 8 – Example showing nine subset outlined with the centre marked in red. Here the step size is equal to the subset size, 51 x 51 pixels.
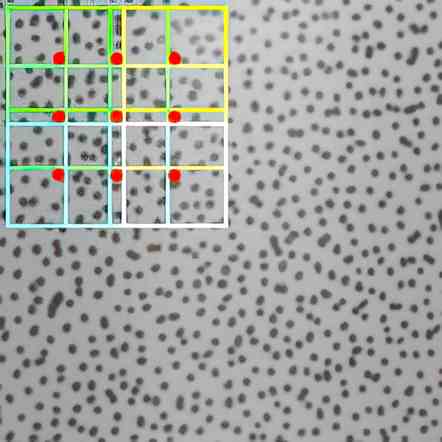
Fig. 9 – Example showing nine subset outlined with the centre marked in red. Here the step size 29 x 29 pixels is smaller than the subset size, 51 x 51 pixels. It clear that more subsets are required to cover the Area of Interest and thus spatial resolution is increased.
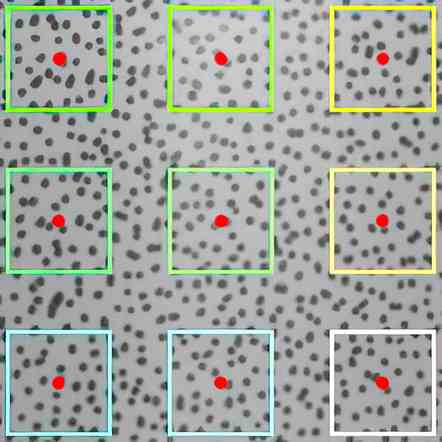
Fig. 10 – Example showing nine subset outlined with the centre marked in red. Here the step size 80 x 80 pixels is larger than the subset size, 51 x 51 pixels. Less subsets are required to cover the area of interest, leading to faster processing but lower spatial resolution.
TEMA Stereo Pro has a great tool called “Accuracy Report” which can be run at this point. It will examine each image frame taken before the force was applied and create a value for the average noise level. Too high, and you’ll know that the DIC results will not be accurate.
A Slave DIC area is then set up on camera view 2 using the same six control points so that we can view the results of the Stereo DIC experiment. Some adjustment of subset size and step size may be required for TEMA to match subsets from camera view 2 with those created in camera view 1.
So let’s take a look at how DIC calculates displacement. We’ll do so with the 2D example Fig. 11a and Fig. 11b, taking the image from Fig. 8 as our reference frame, and placing alongside it a frame with exaggerated displacement for the benefit of explanation.
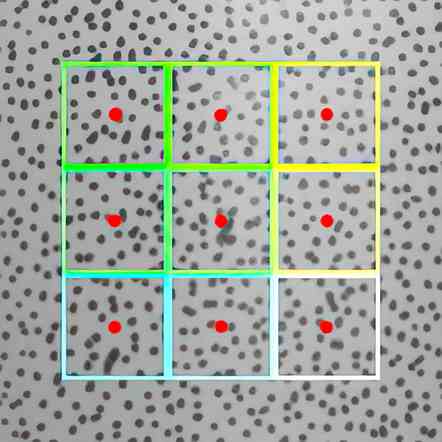
Fig. 11a – Example showing nine subset before exaggerated displacement.
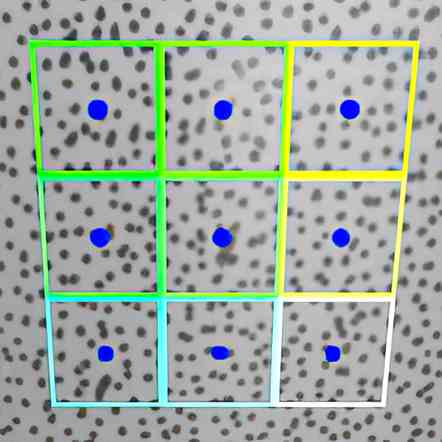
Fig. 11b – Example showing nine subset after exaggerated displacement.
Superimposing the two frames as per Fig. 12 will allow us to visualise the displacement calculated by the DIC software. The white arrows from the red spots to the blue spots giving direction and distance.
With the Area of Interest matched in camera view 2, TEMA can perform Stereo DIC calculations for the duration of the test and in as much detail as defined by the subset, step size, and frame rate.
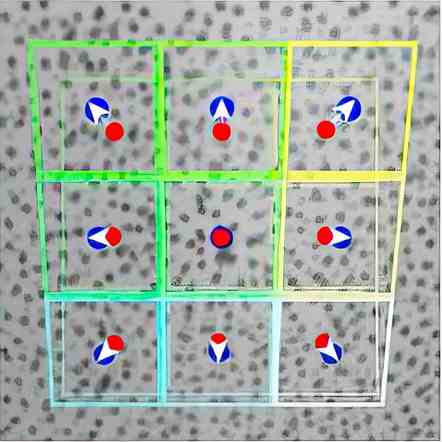
Fig. 12 – Superimposing the subsets and their centres in the reference frame and after displacement allows us to visualise the displacement.
In the real mug experiment boiling water was poured into the enamel mug about 3.4 seconds into the test. Colour coding allows easy visualisation of the mug as it expands, the top more than the bottom, as shown in the video below. TEMA also provide graph and other direct measurement tools.

Fig. 13 – TEMA Stereo Pro results of Mug and boiling water experiment.
For a more comprehensive guide consider reading the “A Good Practice Guide for Digital Image Correlation” by the International Digital Image Correlation Society https://www.idics.org/guide/. To learn more about TEMA Pro Digital Image Correlation, please give us a call or send an email enquiry.
Disclaimer: The information in this guide is designed to help you understand our products. It is correct to the best of our knowledge and at the time of writing. However Photo-Sonics International Limited does not accept any liability for its use. Instead the latest documentation from the relevant authority should be consulted.